Rのbaseパッケージのbarplot関数を使って棒グラフの様々な設定のご紹介です。横棒グラフや凡例の設定もあわせてご紹介です。棒グラフはカテゴリ毎の数値比較をするときに直感的に理解しやすいグラフでよく使われているものの一つです。
棒グラフの作成
# 前準備
 d <- read.csv('https://raw.githubusercontent.com/maruko-rosso/datasciencehenomiti/master/data/ShopSales.csv',header = T)
 d_cross <- as.data.frame(table(d$staff))
 barplot(d_cross$Freq,legend.text = d_cross$Var1,names.arg = d_cross$Var1)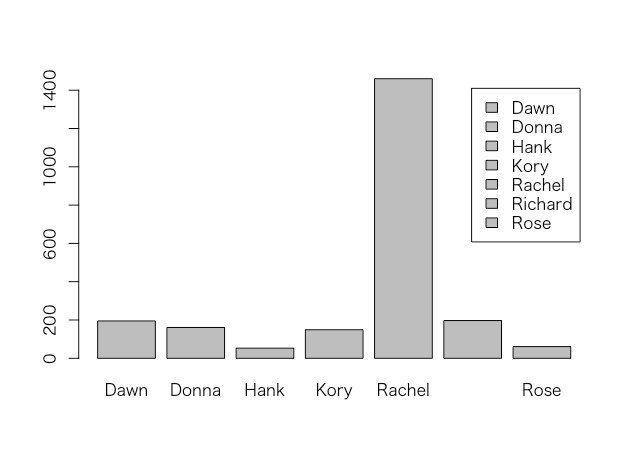
棒グラフの様々な色設定方法
par(mfrow = c(2,2))
 barplot(d_cross$Freq, col = d_cross$Var1, main = "pattern 1")
 barplot(d_cross$Freq, col = "lightblue", main = "pattern 2")
 barplot(d_cross$Freq, col = c("lightblue","blue"), main = "pattern 3")
 barplot(d_cross$Freq, col = c("lightblue","blue","red"), main = "pattern 4")
 par(mfrow = c(1,1))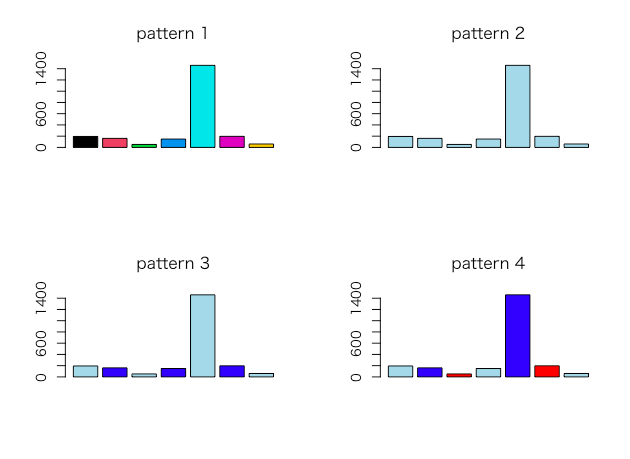
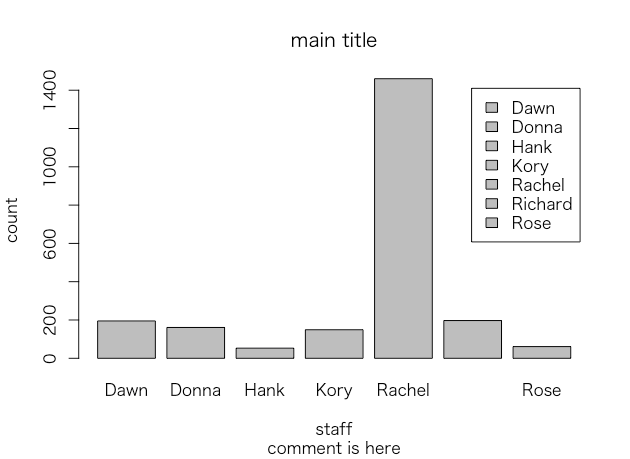
棒グラフのタイトルやラベルの付け方
barplot(
   d_cross$Freq,
   legend.text = d_cross$Var1,
   names.arg = d_cross$Var1,
   main = "main title",
   ylab = "count",
   xlab = "staff",
   sub = "comment is here"
 )
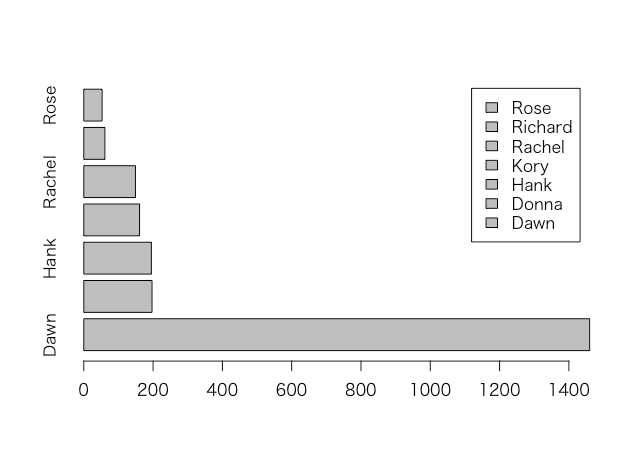
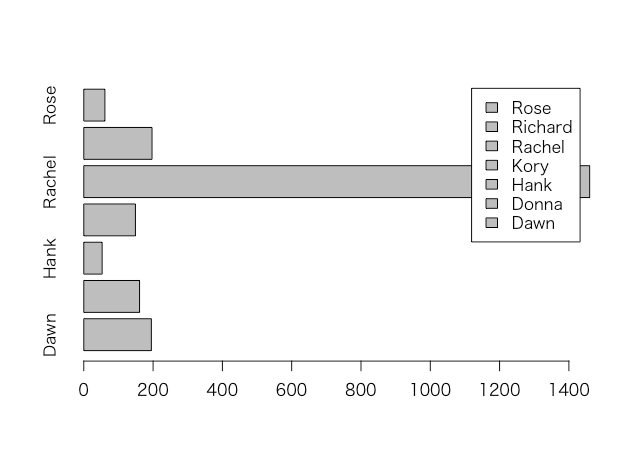
横棒グラフの作り方
# 横棒グラフ
 barplot(
   d_cross$Freq,
   legend.text = d_cross$Var1,
   names.arg = d_cross$Var1,
   horiz = T
 )
棒グラフの並び替え
barplot関数で使うデータフレームをorder関数を使って並び替えるのが手軽です。
# データテーブルの並び替え
 d_cross_2 <- d_cross[order(d_cross$Freq, decreasing = T), ]
# 横棒グラフ
 barplot(
   d_cross_2$Freq,
   legend.text = d_cross$Var1,
   names.arg = d_cross$Var1,
   horiz = T
 )