Rのbaseパッケージに入っているplot関数を利用した散布図の作り方のご紹介です。散布図は2変数の関係性をみるために各要素の散らばり具合や分布がどのようになっているかを確認するときに使います。このラベル付けやタイトルや軸ラベルの付け方のご紹介です。
散布図の作成
Rに組み込まれているirisのデータセットを利用して進めようと思います。
  > head(iris)
     Sepal.Length Sepal.Width Petal.Length Petal.Width Species
   1          5.1         3.5          1.4         0.2  setosa
   2          4.9         3.0          1.4         0.2  setosa
   3          4.7         3.2          1.3         0.2  setosa
   4          4.6         3.1          1.5         0.2  setosa
   5          5.0         3.6          1.4         0.2  setosa
6 5.4 3.9 1.7 0.4 setosa シンプルな散布図は以下のよう記載することで作れます。type = “p”の部分はR側での認識がうまくいくと省略することも可能です。
plot(x = iris$Sepal.Length,y = iris$Sepal.Width, type = "p")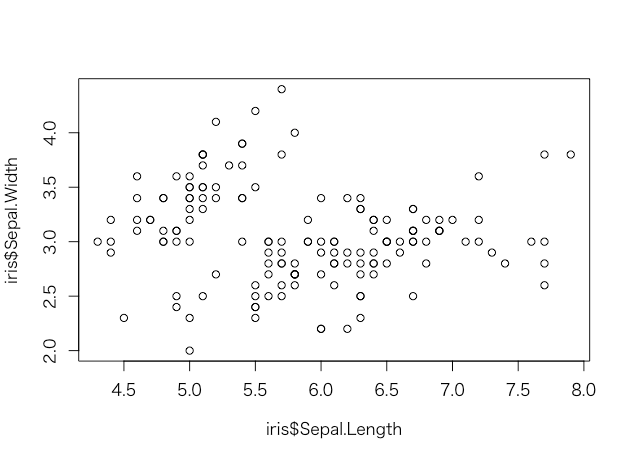
散布図のラベル付け
点をプロットしただけでなくどの要素がどこに散っているかを確認したいときは以下のようにtype = “n”でプロットの点をなくし、text関数でラベルをプロットします。
plot(x = iris$Sepal.Length,y = iris$Sepal.Width, col = iris$Species,type = "n")
 text(x = iris$Sepal.Length,y = iris$Sepal.Width, labels = iris$Species)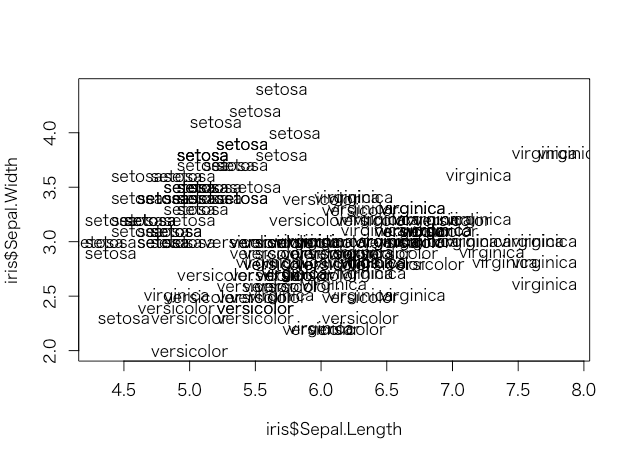
散布図の色分け
par(mfrow = c(1,2))
 plot(x = iris$Sepal.Length,y = iris$Sepal.Width, ,type = "p",col = c("red","blue","green"))
 plot(x = iris$Sepal.Length,y = iris$Sepal.Width, col = iris$Species,type = "n")
 text(x = iris$Sepal.Length,y = iris$Sepal.Width, labels = iris$Species,col = c("red","blue","green"))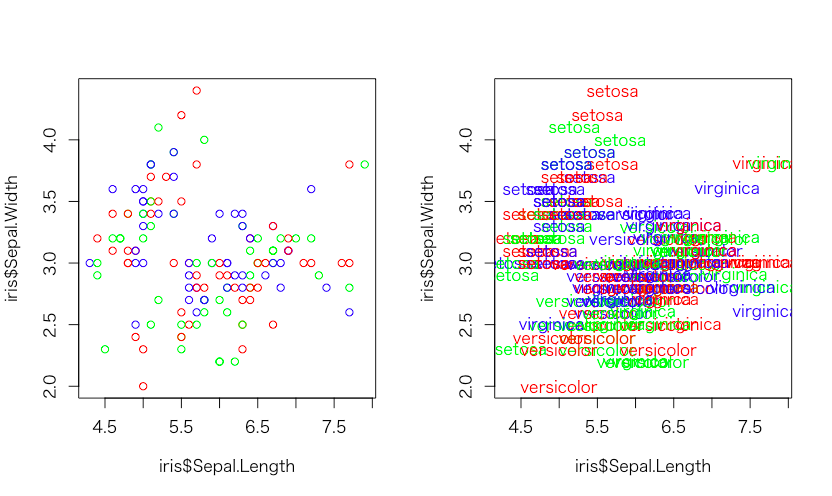
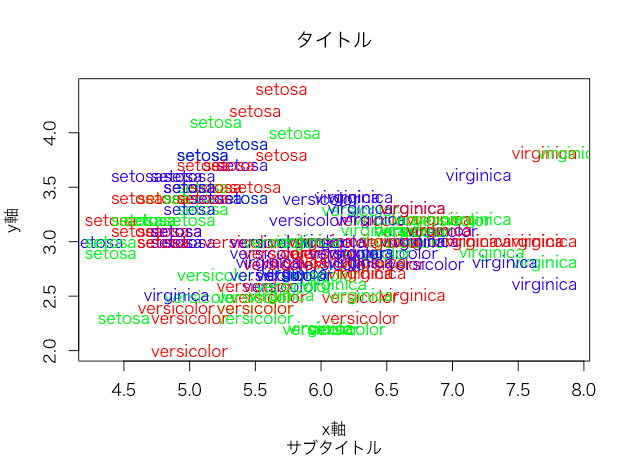
散布図のタイトルや軸ラベル
plot(
   x = iris$Sepal.Length,
   y = iris$Sepal.Width,
   col = iris$Species,
   type = "n",
   main = "タイトル",
   xlab = "x軸",
   ylab = "y軸",
   sub = "サブタイトル"
 )
 text(
   x = iris$Sepal.Length,
   y = iris$Sepal.Width,
   labels = iris$Species,
   col = c("red", "blue", "green")
 )