ggplotやbaseパッケージのグラフで使うカラーパレットについてです。どんなものがあるのかと、設定の方法をご紹介します。
カラーパレットの種類
library(RColorBrewer)
 display.brewer.all()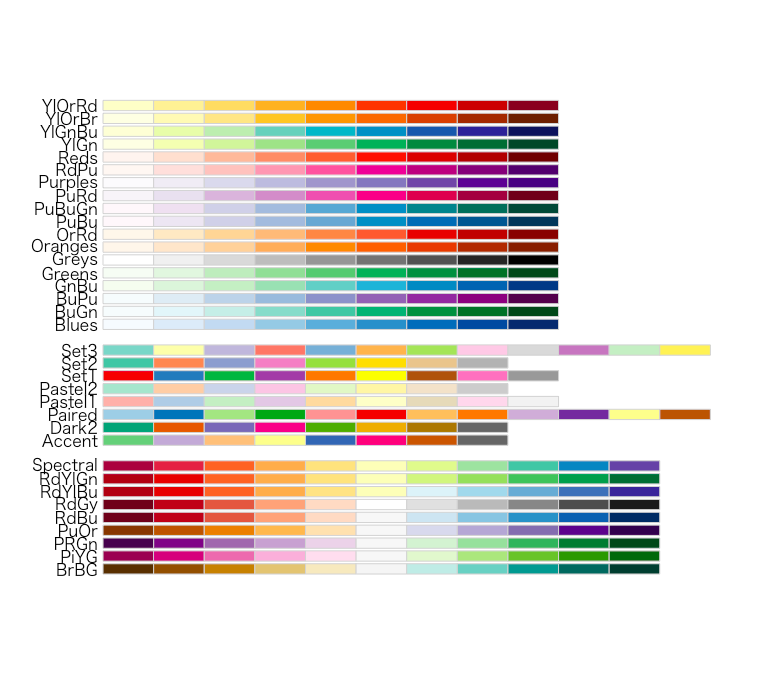
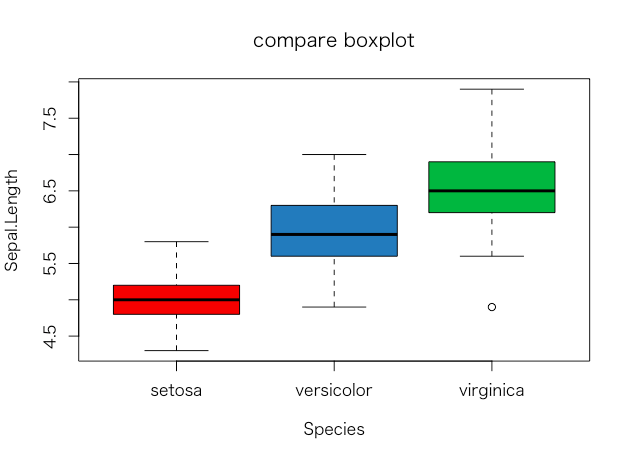
baseパッケージでの色変更の使い方
brewer.pal()を使います。nの数を絞ることもできますし、パレット数分に設定することもできます。パレットの数を最大にしてくのがおすすめです。
cols <- brewer.pal(n = 7, "Set1")
 boxplot(
   Sepal.Length ~ Species,
   data = iris,
   main = "compare boxplot",
   col = cols
 )
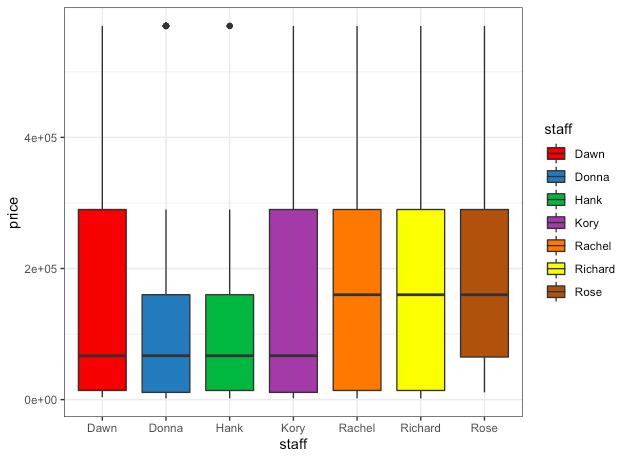
ggplotでの色変更のやり方
scale_fill_brewer(palette=’palette’)で設定します。以下はSet1を使っています。
d <- read.csv('https://raw.githubusercontent.com/maruko-rosso/datasciencehenomiti/master/data/ShopSales.csv',header = T) d %>%
   ggplot(aes(x = staff,y = price,fill = staff)) +
   geom_boxplot() + scale_fill_brewer(palette='Set1')