顔妻です。
折れ線グラフの作り方のご紹介です。今回は以下のデータを使いました。
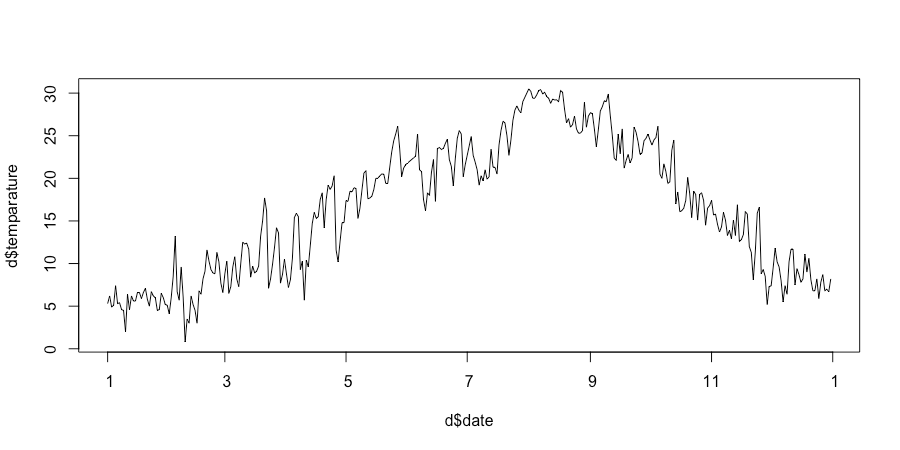
下準備とplot での折れ線
plot の折れ線はtypeを「’l’」にする必要があります。
#下準備
library(tidyverse)
library(ggplot2)
library(scales)
library(mondate)
theme_set( theme_bw(base_family = ‘HiraKakuProN-W3’)) # macの文字化け対策用
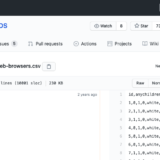
# import data
d <- read.csv(“weathere_tokyo_2019.csv”, header = T)
d$date <- as.Date(d$date) # 日付型に変更
# plotでの可視化
plot(x = d$date, y = d$temparature, type = “l”)
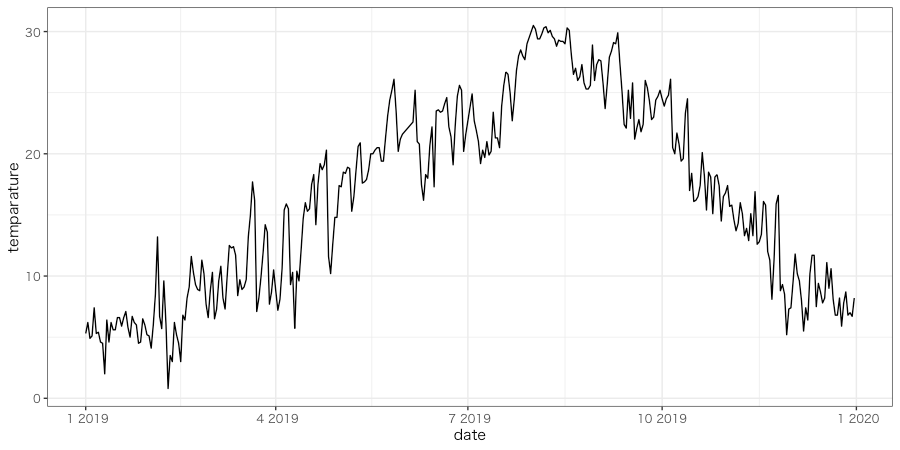
ggplotで可視化①
# ggplotを使った可視化
d %>%
ggplot(aes(x = date, y = temparature)) +
geom_line() +
scale_fill_brewer(palette=’Set1′)
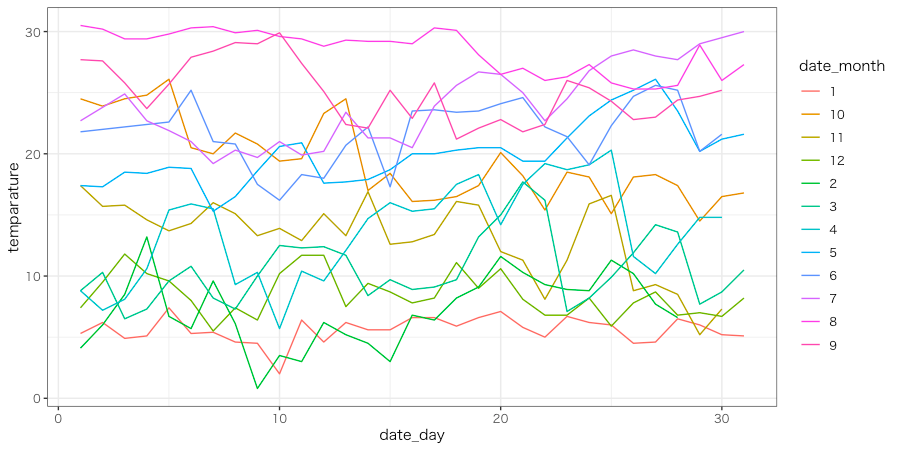
ggplotで可視化② ~複数の折れ線~
# 前処理
d <- d %>%
mutate(date_month = as.character(month(date)), date_day = day(date))
# 複数の折れ線グラフ
d %>%
ggplot(aes(x = date_day, y = temparature, color = date_month)) +
geom_line() +
scale_fill_brewer(palette=’Set1′)